
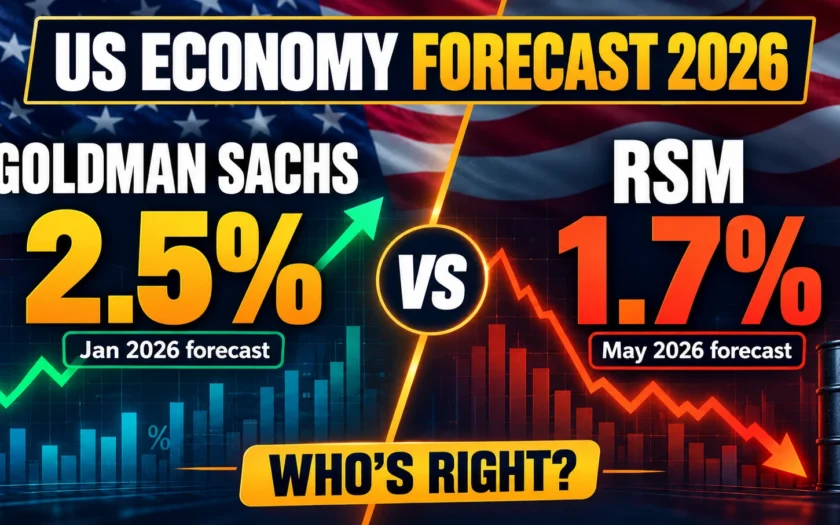
Your savings, your mortgage and your next paycheck ride on one number, and the smartest forecasters in America can’t agree on it. The US economy forecast 2026 now has Goldman Sachs at 2.5% growth and RSM at 1.7%, and the gap hides a twist most headlines missed. This guide shows you which number holds up, using live forecasts, Fed data and page-referenced findings from the WEF Global Risks Report 2026.
Read it once and you’ll know what to watch, what to ignore and where the real risk sits.
Why a 0.8-Point Gap Matters More Than It Looks
Growth forecasts look like rounding errors. They aren’t. The US economy is a $31 trillion machine, so 0.8 percentage points equals roughly $250 billion of output: jobs, wages and profits that either exist or don’t.
What the Gap Decides
Growth near 2.5% keeps hiring steady and gives stocks room to run. Growth near 1.7% starves job creation and corners the Fed, because slow growth and rising prices arrive together. Every US economy forecast 2026 you read is a bet on that fork. If you want to know how the 2026 economy affects your savings, start with which side of the fork you’re standing on.
Goldman’s 2.5% Call: The Bull Case
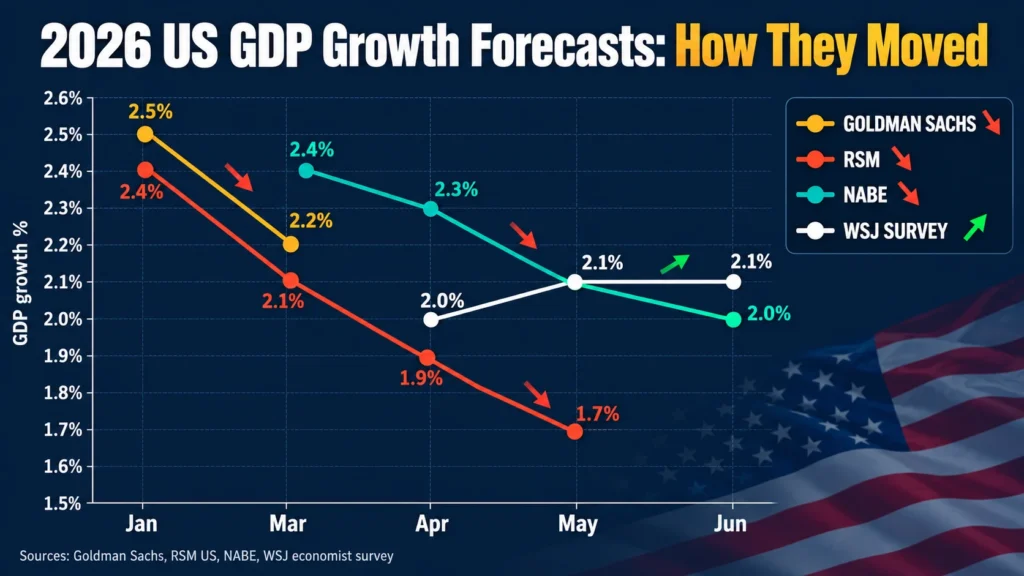
In January, Goldman Sachs Research told clients the US would grow 2.5% in 2026, measured fourth quarter over fourth quarter. Consensus sat at 2.1%. Chief US economist David Mericle called the above-consensus growth view and the below-consensus inflation view his team’s strongest convictions.
The Engine Behind the Optimism
Two forces powered the call. The drag from tariffs was set to fade, and business and personal tax cuts from the One Big Beautiful Bill Act were set to add fuel. Goldman put its full-year growth figure at 2.8% and cut its 12-month recession odds from 30% to 20%. It was the boldest big-bank call on the board.
The Revision Most Headlines Skip
Here is the twist. After energy prices surged on the Iran war, Goldman cut its Q4/Q4 forecast by 0.3 points to 2.2% and raised its peak unemployment call to 4.6%. By late March it lifted recession odds back to 30%. The 2.5% in this article’s title is Goldman’s January number. Goldman has already moved toward RSM’s camp.
RSM’s 1.7% Call: The Bear Case
RSM US did not start the year bearish. It opened 2026 at 2.4% growth. Then the war in Iran hit energy markets, and on May 5 RSM cut its 2026 GDP call to 1.7%.
The Energy Shock Behind the Cut
RSM raised its 12-month recession in 2026 probability to 30%, up from 20% before the war. It lifted its inflation peak to 4.5% on CPI and 3.5% on the PCE gauge the Fed targets, and pushed peak unemployment to 4.6%. The logic is direct: expensive energy taxes every household and every supply chain at the same time. For the oil side of the story, see how the Iran drone strike on Aramco’s Ras Tanura facility sent oil prices spiking.
What “Stagflation Light” Means
RSM calls the result stagflation in mild form: slower growth, higher prices and rising unemployment together. Notice what RSM does not say. It describes the economy as a “resilient beast” that absorbs the shock without tipping into recession. The 1.7% is a slowdown call, not a crash call. RSM also states that a holding ceasefire eases inflation and lowers recession risk.
Same Question, Different Yardsticks
Before you pick a winner, check the measuring stick. Goldman’s 2.5% is a Q4-over-Q4 figure, while its full-year number at the time was 2.8%. Set a Q4/Q4 figure beside an annual figure and the gap looks wider or narrower than it is. RSM states its call as growth for 2026, so confirm the basis in its report before treating 0.8 points as apples to apples. This table lines up every major call with its date and driver.
| Forecaster | Growth call | Date | Main driver | 12-month recession odds |
|---|---|---|---|---|
| Goldman Sachs (original) | 2.5% Q4/Q4 (2.8% full-year) | Jan 15, 2026 | Tax cuts, fading tariff drag | 20% |
| Goldman Sachs (revised) | 2.2% Q4/Q4 | March 2026 | Energy-price shock | 30% |
| RSM US | 1.7% (down from 2.4%) | May 5, 2026 | Iran war energy shock | 30% |
| NABE panel median | 2.0% (down from 2.4%) | June 2026 | Softer growth, higher inflation | 65% see recession in 2028 or later |
| WSJ survey of 72 economists | 2.1% | June 2–7, 2026 | Resilient demand, sticky inflation | 25% |
The takeaway: the spread has collapsed. Goldman moved down, the consensus settled near 2%, and RSM holds the low end. The live debate is 1.7% versus 2.2%, not 2.5% versus 1.7%.
What the Wider Consensus Says
The Economist Surveys
The Wall Street Journal’s June survey of 72 economists pegged 2026 growth at 2.1% and cut average recession odds to 25% from 33%, the lowest since early 2025. Economists expect about 65,000 new jobs a month and oil near $70 by December. The National Association for Business Economics landed at 2.0% growth and raised its inflation call to 3.6% from 2.7%. A majority, 65% of its panel, expects the next recession in 2028 or later.
Where Every Forecaster Agrees
Growth slows. Inflation stays above target. Nobody forecasts a collapse. When Goldman, RSM, the WSJ panel and NABE all cluster between 1.7% and 2.2%, the US GDP forecast 2026 is a range, not a point. The disagreement is about inflation and the Fed, and that’s where the money moves.
The Fed Changed the Script in September
The First Hike Since 2023
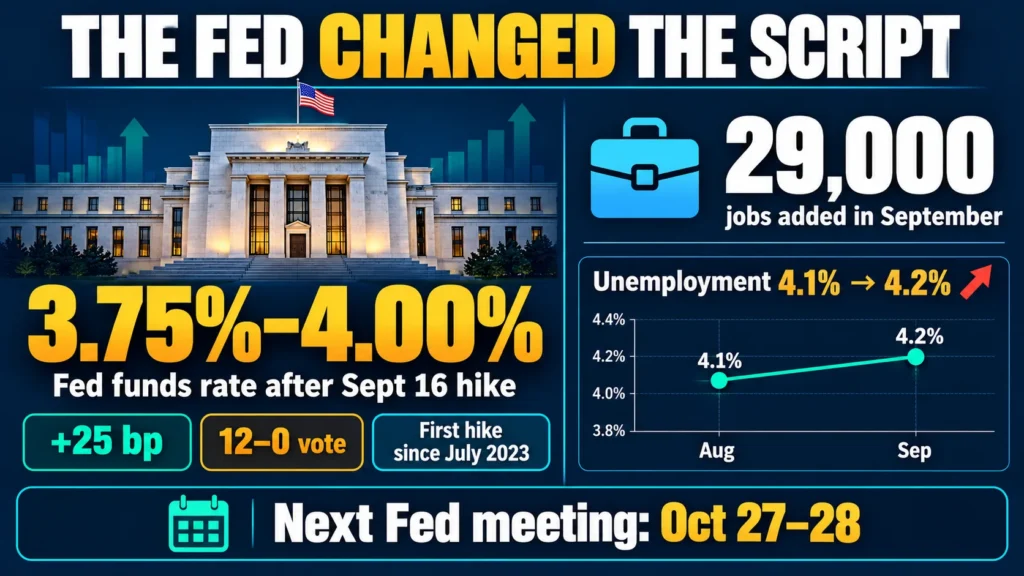
On September 16, the Fed raised rates 25 basis points, unanimously, to 3.75%–4.00%. It was the first hike since July 2023 and came under Chair Kevin Warsh, who took office in May. Sixteen of 18 officials now project at least one more hike this year, and Goldman treats two quarter-point hikes as its 2026 baseline. In January, Goldman expected cuts. That flip rewrote every Fed rate forecast 2026 on the market. If you hold stocks or bonds, read how the Kevin Warsh rate hike affects your portfolio.
The Job Market Is Cracking
September payrolls added just 29,000 jobs, and unemployment ticked up from 4.1% to 4.2%. Prediction markets responded by pricing a hold at the October 27–28 meeting at about 77%. A hiking Fed meeting a weakening labor market is the setup that turns a slowdown into a recession. For the bond-market side, see our breakdown of the September jobs report and Treasury yields.
Inflation: The Variable That Breaks Both Forecasts
Energy Is Doing the Damage
Gasoline averaged $4.37 a gallon on October 7, against $3.16 a year earlier. August CPI held at 3.4% year over year. Forecasters entered the September release expecting headline CPI near 3.6%–3.7% with core near 2.4%–2.5%. That headline-versus-core gap tells you the story: this is an energy-driven squeeze, not broad overheating. Yet.
Why It Hurts the Bull Case
The inflation half of Goldman’s January call, core PCE falling to 2.1% by December, now runs into a $4 gallon of gas. Fed Governor Waller warned on October 8 that persistent inflation can embed in expectations. Once that happens, rate hikes get bigger and growth takes the hit. Any honest US inflation forecast 2026 has to price that risk.
What the WEF Global Risks Report 2026 Says About the US Outlook
The World Economic Forum report, published January 14, 2026, draws on more than 1,300 experts. It does not forecast GDP. Its risk signals, though, line up with RSM’s caution. For the full breakdown, see our guide to the Global Risks Report 2026 explained.
Economic Downturn Jumped Eight Places
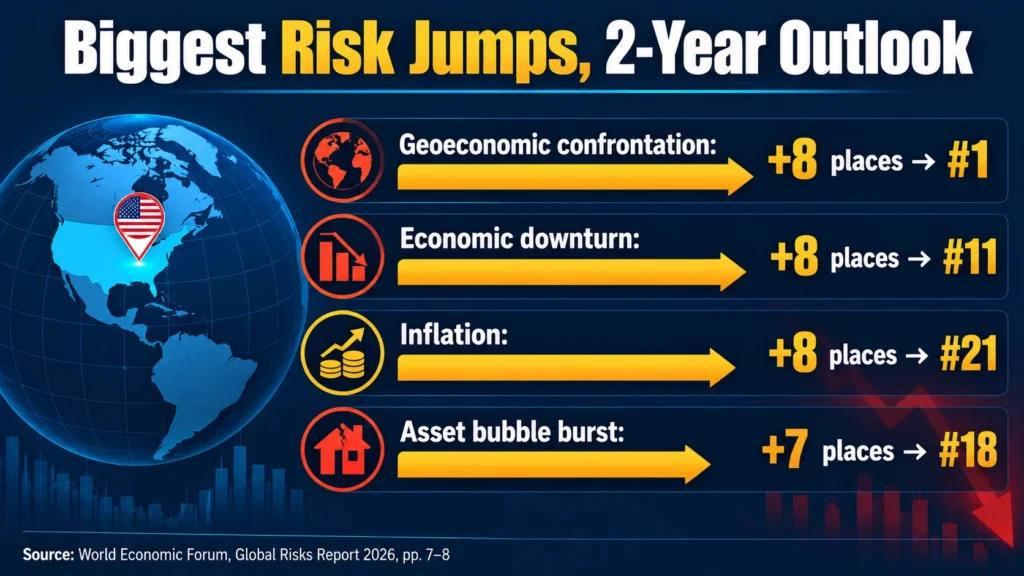
Economic downturn and inflation each climbed eight positions in the two-year risk ranking, to #11 and #21. Asset bubble burst rose seven places to #18 (p. 8). Geoeconomic confrontation, the tariff-and-sanctions fight, was picked by 18% of respondents as the most likely trigger of a global crisis in 2026 (p. 7).
The AI Bubble Hits US Stocks First
WEF flags that global investors are heavily invested in US stock markets, and 85% of chief economists surveyed in September 2025 expect a financial shock to cause wide-ranging systemic effects (p. 43). Global AI spending is estimated at $1.5 trillion in 2025 and $2 trillion in 2026 (p. 44). That spending props up growth today and creates the reversal risk tomorrow.
The US Debt Backdrop
The US fiscal deficit rises from 5.6% of GDP in 2025 to 5.9% in 2026 and 6.0% in 2027. Federal debt held by the public climbs from 100% of GDP to 120% by 2035, passing the 106% record set in 1946 (p. 41).
| WEF signal | Figure | Page | Why it matters for the forecast |
|---|---|---|---|
| Economic downturn ranking | Up 8 places to #11 | 8 | Experts see more downside than a year ago |
| Inflation ranking | Up 8 places to #21 | 8 | Backs the higher-inflation camp |
| Asset bubble burst | Up 7 places to #18 | 8 | AI-heavy markets are a growth risk |
| Top 2026 crisis trigger | Geoeconomic confrontation, 18% | 7 | Trade fights feed the price shock |
| US fiscal deficit | 5.9% of GDP in 2026 | 41 | Less fiscal cushion in a slowdown |
| Global AI spending | $2 trillion in 2026 | 44 | Growth support with reversal risk |
| IMF global growth | 3.1% in 2026 | 40 | Below the 3.7% average of 2000–2019 |
The pattern is clear: every row points to a slower, more fragile backdrop than January’s optimism assumed.
Who’s Right? The Verdict
The Case for the Middle
Both are partly right. Goldman’s growth engine, the tax cuts, is real. RSM’s energy shock is just as real. Goldman cut itself to 2.2%, the surveys sit at 2.0%–2.1%, and Q2 growth was reported at 1.5% annualized, softer than January’s script. The data puts the US GDP forecast 2026 at 1.7% to 2.2%.
Our Read
On growth: the middle. On inflation: RSM’s camp. On recession: not the base case, with surveys pricing 25%–30%. The danger scenario is specific. Hiking into a 29,000-job month is how a soft landing breaks. So the US recession forecast 2026 hinges less on GDP than on the Fed’s next two moves. The result lands in 2027, when Q4 data closes the Q4/Q4 books.
How the 2026 Economy Affects Your Money
If You Invest
Concentration is the risk WEF keeps flagging. If a few AI giants dominate your index fund, you hold that bubble risk. Review your exposure. For the bigger picture, read how global recession risk and the AI bubble flagged in the WEF report connect.
If You Save or Borrow
Higher rates lift savings yields and keep loans and mortgages expensive. Fix what you can, shorten what you must, and keep an emergency fund sized for a slower job market.
UK Readers
A US slowdown reaches Britain through trade, markets and rates. Goldman has already pushed back its Bank of England cut timing on the energy outlook, so the US recession impact on the UK economy shows up first in borrowing costs.
Dates That Move the Forecast
- October 27–28: Fed meeting
- November 10: October CPI release
- December 8–9: final Fed meeting of 2026
FAQ
Will the US economy enter a recession in 2026?
The base case says no. Surveys price the odds at 25% (WSJ economists) to 30% (RSM and Goldman’s March call), and 65% of NABE panelists place the next recession in 2028 or later.
How much will the US economy grow in 2026?
Forecasts run from 1.7% (RSM) to 2.2% (Goldman’s revision), with surveys near 2.0%–2.1%. Always check whether a figure is Q4/Q4 or annual.
Will the Fed raise rates again in 2026?
Officials signal yes. Sixteen of 18 project another hike, Goldman expects two in total, and markets priced a hold in October after the weak jobs report. December is the next window after October 27–28.
Is Goldman or RSM more accurate?
Neither is settled until Q4 GDP posts. Goldman has already trimmed to 2.2%, which narrows the gap toward RSM.
How does the Iran war affect the US economy?
It lifts energy prices, which lifts inflation and trims growth. RSM’s 2.4%-to-1.7% cut came directly from that shock.
Conclusion
Goldman’s 2.5% was a January bet on tax cuts. RSM’s 1.7% is a May reaction to an energy shock. The evidence points to the middle on growth, the cautious camp on inflation, and a recession that stays the minority outcome while the Fed keeps its balance. Don’t wait for a forecast to prove right. Build a plan that survives both. Forecasts will keep changing. Your plan shouldn’t depend on any single one.
Disclaimer: This article is for informational and educational purposes only. It is not financial, investment, tax or legal advice. Forecasts change, and figures reflect sources available as of October 16, 2026. Consult a licensed professional before making financial decisions.
Sources and References
Goldman Sachs Research, “US GDP Growth Is Projected to Outperform Economist Forecasts in 2026,” January 15, 2026. Figures used: 2.5% Q4/Q4 growth, 2.1% consensus, 2.8% full-year growth, recession odds cut from 30% to 20%. Read the Goldman Sachs forecast
Goldman Sachs revision to 2.2% Q4/Q4 growth and 4.6% peak unemployment (March 2026), as reported by Hellenic Shipping News; recession odds raised to 30% (March 24, 2026), as reported by Argaam.
RSM US, “The Real Economy: RSM lowers its GDP forecast for 2026 to 1.7%,” May 5, 2026. Figures used: 1.7% growth (from 2.4%), 30% recession odds, 4.5% CPI peak, 3.5% PCE peak, 4.6% peak unemployment. Read the RSM analysis
NABE June 2026 Outlook Survey, via Staffing Industry Analysts, June 22, 2026. Figures used: 2.0% growth, 3.6% inflation, 65% expecting recession in 2028 or later. See the NABE survey coverage
Wall Street Journal survey of 72 economists (June 2–7, 2026), as reported by FN News, July 13, 2026. Figures used: 2.1% growth, 25% recession odds, 65,000 jobs a month.
Federal Reserve September 16, 2026 decision (25 bp hike to 3.75%–4.00%), Goldman Sachs post-meeting revision (two-hike baseline, 16 of 18 officials), and September jobs data (29,000 jobs; 4.2% unemployment), as reported by OrbitRemit, Crowdfund Insider and Kalshi News. Gasoline price and CPI figures: Admiral Markets and Liquidity Finder CPI previews, October 2026. Q2 2026 growth of 1.5% annualized as reported by Crypto Briefing; confirm against the BEA release.
WEF, Global Risks Report 2026 (14 January 2026):
Figure: 18% of respondents chose Geoeconomic confrontation as top risk for a material global crisis in 2026. Page 7.
Figure: Economic downturn up 8 places to #11; Inflation up 8 to #21; Asset bubble burst up 7 to #18. Page 8.
Figure: IMF projection of 3.1% global growth in 2026 vs the 3.7% 2000–2019 average. Page 40.
Figure: US deficit 5.6% (2025), 5.9% (2026), 6.0% (2027) of GDP; federal debt held by public 100% to 120% by 2035, above the 106% record of 1946. Page 41.
Figure: 85% of global chief economists (Sept 2025) expect a financial shock to have wide-ranging systemic effects. Page 43.
Figure: Global AI spending $1.5 trillion (2025) to $2 trillion (2026). Page 44.
Open the WEF Global Risks Report 2026
About the Author – Abhishek Chouhan
Abhishek Chouhan is a Global Finance Analyst and Market Researcher with over 15 years of experience studying stock markets, investor behavior, and long-term wealth cycles across the US, Europe, and Asia. He is the founder of MoneyUncut.com, a global financial intelligence platform focused on decoding market psychology, economic trends, and how human behavior shapes financial outcomes.