
You bought gold, watched silver sprint past it, and felt the gut-drop of backing the wrong metal. One number explains that gap, and it hands you a rule for your next move. That number is a gold silver ratio of 80. In the next few minutes you will learn what it means, how smart investors act on it, and the one mistake that turns a good signal into an expensive trade.
What Does a Gold Silver Ratio of 80 Mean?
A gold silver ratio of 80 means one ounce of gold buys 80 ounces of silver. Gold is priced 80 times higher than silver, and investors read that gap as a relative-value signal: at 80, silver is cheap against gold, and gold is expensive against silver.
That is the core idea. The rest of this guide shows when the signal works, when it fails, and how to use it without handing your returns to dealers.
How the Ratio Is Calculated
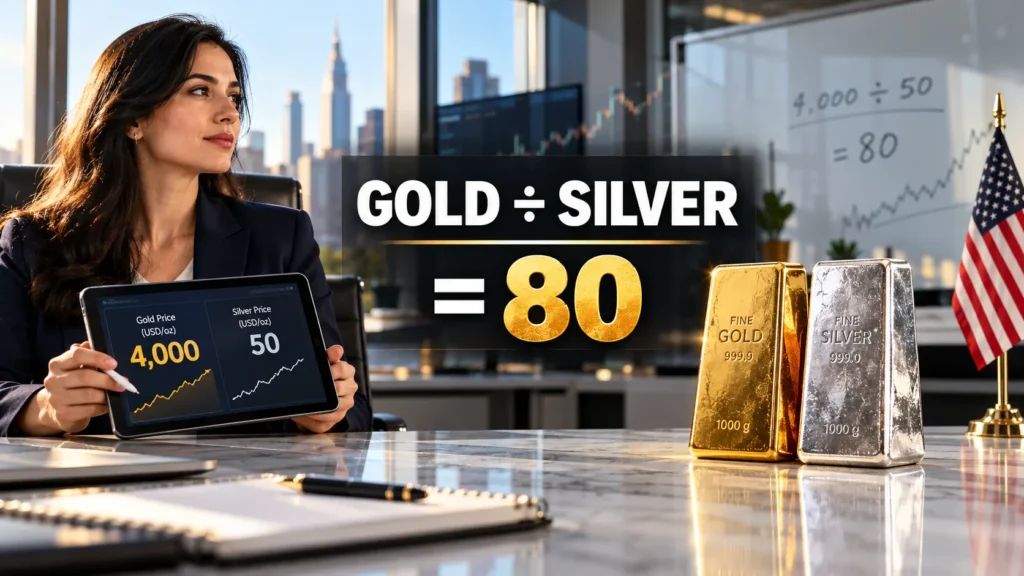
Divide the gold price per ounce by the silver price per ounce. Gold at $4,000 and silver at $50 gives you 80. Many sites call it the gold to silver ratio, and some traders flip the math into the silver to gold ratio (50 ÷ 4,000 = 0.0125). Same data, opposite angle. The market quotes the version with 80 in it, so that is the one to learn.
Why Relative Value Matters
Gold and silver react to the same forces, fear, inflation and currency worries, but at different intensities. Silver swings harder in both directions. The ratio squeezes that relationship into one number you can track daily. A dollar price tells you what a metal costs. The ratio tells you what it costs compared with its closest rival, and that comparison is where the opportunity hides.
Why 80 Became the Line Investors Watch
It Is a Convention, Not a Law
No exchange sets 80, and no regulator enforces it. Traders settled on it because readings that high have lined up with unusually cheap silver again and again. Others use 70 or 90 as their trigger. The exact number matters less than the logic: you wait for the ratio to stretch far beyond its normal range, then you act with a plan.
80 Against the Long-Run Average
Context gives 80 its weight. The gold silver ratio historical average depends on the dataset: about 47 across the 20th century, according to the Perth Mint’s guide to gold to silver ratio trading, and roughly 60 to 65 since 1971, when the gold standard ended. Against that 60 to 65 baseline, 80 sits a quarter to a third above normal. That distance is what investors call stretched. Below 50, the stretch flips direction and silver looks expensive.
What Moves the Gold Silver Ratio
Three forces push the ratio around. Know them and the ratio stops surprising you.
Fear Pushes Gold Ahead
Gold is the panic asset. When markets crack, money runs to gold first and silver gets dragged down with the risk assets, so the ratio climbs. Our breakdown of how gold behaves during a market crash shows that pattern in detail. Fear lifts the ratio. Calm lets it fall.
Factories Pull Silver Along
Silver has a second job that gold never takes. Roughly half of silver demand comes from industry: solar panels, electronics, electric vehicles. Gold’s industrial share sits near 7% to 10%. When factories boom, silver gets a demand push and the ratio drops. When manufacturing stalls, silver loses that support and the ratio rises.
Interest Rates Set the Backdrop
Gold pays no yield, so rising rates weigh on it and falling rates lift it. Silver feels the same rate moves, but its factory demand pulls it in a second direction, so the two metals rarely move in step. To see how rate decisions travel through every asset class, read how interest rates control global markets.
Gold Silver Ratio History: Extremes That Taught Hard Lessons
From Fixed Ratios to a Free Float
Governments once set the relationship by decree. The U.S. Coinage Act of 1792 fixed it at 15 to 1. Once the gold standard ended in the early 1970s, nothing held the ratio in place, and every swing on a gold silver ratio chart since then comes from open-market trading.
1980 and 2020: The Two Poles
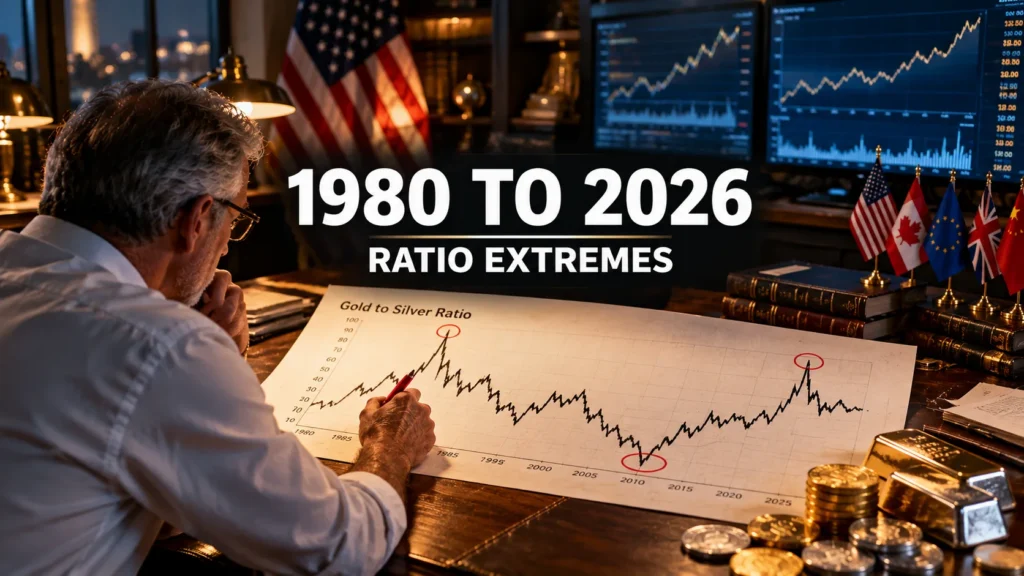
In January 1980 the ratio fell to roughly 15 to 17 as the Hunt brothers’ squeeze pushed silver near $50, a low that Money Metals’ ratio history lays out alongside the later extremes. Silver collapsed soon after, and gold dominated for decades. The opposite pole arrived in March 2020, when pandemic panic sent investors into gold while silver fell. The ratio topped 120, and MoneyWeek’s guide to the gold-silver ratio puts the record at 125 to 1. That settles the highest and lowest gold silver ratio ever question: about 15 to 17 at the bottom, about 125 at the top.
2008 and January 2026: Same Pattern, Fresh Proof
The 2008 financial crisis drove gold above 80 times silver. Panic reaches for gold first, a pattern we trace in our look at stock market crashes from 1929 to 2008 and 2026. Then came 2026. The ratio crossed 100 in April 2025, and by January 29, 2026, silver had hit a record $121.62 with the ratio near 50, as GoldSilver’s 2026 ratio report records. One session later, silver lost roughly 30%. That is a 50-point swing in under a year. One reading never tells the full story.
The Gold Silver Ratio Zones at a Glance
Here is the cheat sheet. Bookmark it.
| Ratio zone | What it signals | How disciplined investors respond |
|---|---|---|
| Below 50 | Silver is expensive against gold | Favor gold for new money; some rotate silver into gold |
| 50 to 70 | Normal range | Hold your split; no ratio-based action |
| 70 to 80 | Silver turns cheaper | Lean new purchases toward silver |
| 80 to 100 | Silver is cheap against gold | Swap part of a gold stack into silver, in stages |
| Above 100 | Historic extreme | Biggest rotation signal and biggest volatility |
Notice the pattern: the further the ratio drifts from its normal range, the louder the signal and the more patience the trade demands.
How to Read a Gold Silver Ratio Chart
Level, Direction, Speed
Open any gold silver ratio chart and check three things. Level: where does the line sit against the 60 to 65 band? Direction: a rising line signals fear or weak industry, a falling line signals silver strength. Speed: slow drifts reflect trends, sudden spikes reflect events. A reading of 80 that took two years to build tells a different story than an 80 that appeared in two weeks.
The Ratio Can Fall While Both Metals Rise
Here is the part beginners miss. If gold gains 10% and silver gains 25%, both metals rise and the ratio falls. If both drop, the ratio can still climb. The ratio tracks the gap between the metals, not the direction of either. Judge your profit by your ounces and dollars, and use the ratio only to judge which metal is better value.
How Investors Use the Gold Silver Ratio
The Swap Strategy
The classic move is simple. When the ratio runs high, sell some gold and buy silver. When it falls back, swap into gold again and finish with more ounces than you started with. You never leave precious metals; you just change which one you hold. That is the gold silver ratio swap strategy, and it rests on mean reversion, the bet that stretched readings snap back toward average.
How to Trade the Gold Silver Ratio With ETFs and Futures
You do not need a vault. Investors rotate between gold and silver ETFs such as GLD and SLV, and advanced traders run a pair trade: long silver futures against short gold futures. Premiums shrink, but financing costs and tracking error step in. Before you pick a broker, compare the best trading platforms for beginners.
Using the Ratio to Direct New Money
So what is a good gold silver ratio to buy silver? Most investors treat 80 and above as the buy-silver zone. Swapping is optional. Many use the ratio only to decide where fresh money goes: at 85, new purchases lean toward silver; at 50, they lean toward gold. No selling, no swap costs, no tax event. For most people this is the cleanest way to apply the signal.
A Worked Example: Swapping at 80 With Real Costs
The Math Most Guides Skip
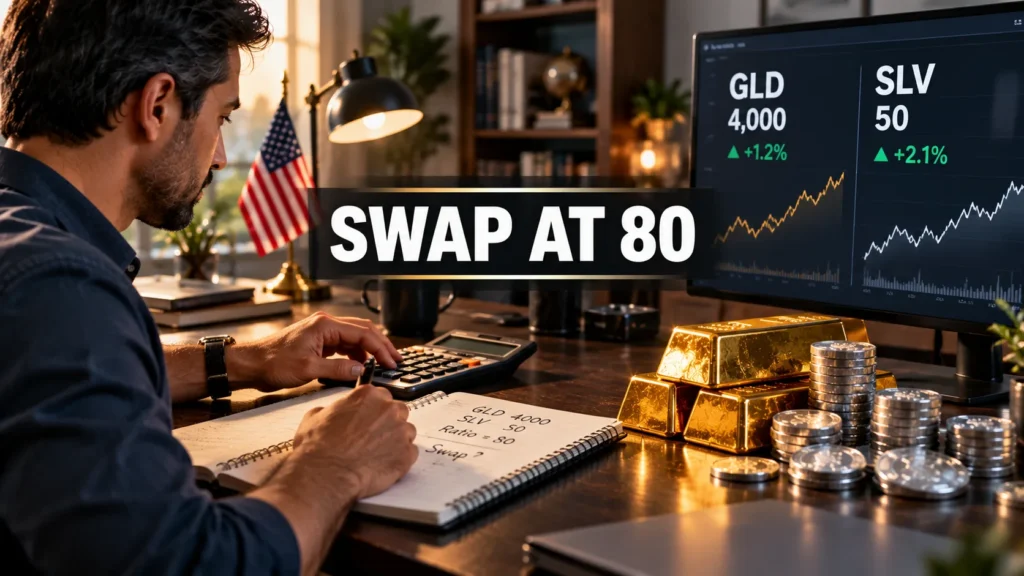
Say you hold 10 ounces of gold with the ratio at 80. You swap into silver and pay 6% in each direction for dealer premium, spread and shipping. Measured in gold ounces, here is where you land when you swap back.
| Ratio when you swap back | Gold ounces after round trip | Result |
|---|---|---|
| 75 | 9.43 | -5.7% |
| 70 | 10.10 | +1.0% |
| 65 | 10.88 | +8.8% |
| 60 | 11.78 | +17.8% |
| 50 | 14.14 | +41.4% |
The break-even sits near 70.7. A slide from 80 to 75 looks like a win on the chart and still loses money in your account.
What the Table Tells You
Costs eat roughly the first nine points of the move. Swap at 80 only when you expect a deep reversion, and size the trade so a stall at 78 does not hurt. Your real costs vary by dealer and product, so run your own numbers before you move.
Where the Gold Silver Ratio Misleads Investors
Every signal has blind spots. These four cost investors real money, and they sit at the heart of the limitations of the gold silver ratio.
Extremes Can Last for Years
A high reading is not a countdown. From 2021 through 2023 the ratio averaged between 75 and 85, and silver stayed cheap on paper year after year. Investors who swapped early waited a long time for the payoff.
Silver Supply Follows Other Metals
A large share of silver arrives as a by-product of mining copper, lead, zinc and gold. Supply responds to those markets, not to silver demand. The ratio can end up reflecting someone else’s cycle, which makes its signal noisier than it looks.
Premiums, Taxes and Storage
Silver coins and small bars often carry premiums of 5% to 15% over spot. Silver also takes up far more space per dollar of value, so storage costs more. Selling metal can trigger taxes, and the rules differ by country and product. Check yours before you rotate.
The Biggest Mistake: Betting on One Number
Investors see 85 and swap their whole stack. Then silver sits still for two years, or dips first. Treat the ratio as one input, not a command. Swap in stages, say a third at 80 and a third at 90, and keep a core gold position you never touch.
Gold Silver Ratio FAQ
What does a gold silver ratio of 80 mean?
It means one ounce of gold buys 80 ounces of silver. That sits well above the long-run average, so investors treat it as a sign that silver is cheap compared with gold.
What is a good gold silver ratio to buy silver?
Most investors start leaning toward silver at 80 and above, and they get more aggressive near 90 to 100. Below 70, the case for silver weakens.
Is the gold silver ratio a buy or sell signal?
No. It is a relative-value gauge. It shows which metal is cheaper against the other and says nothing about when the move starts. Combine it with trend, time horizon and position size.
What were the highest and lowest gold silver ratios ever?
The ratio hit roughly 15 to 17 in January 1980 and about 125 in March 2020. Exact figures differ by dataset, so name your source when you quote them.
Can you trade the gold silver ratio without buying physical metals?
Yes. Use gold and silver ETFs such as GLD and SLV, or futures pair trades. You skip dealer premiums and storage, but you take on fund fees, financing costs and tracking error.
Does the gold silver ratio predict silver prices?
No. It describes the gap between two prices and never forecasts either one. High readings have often preceded silver strength, but 2021 to 2023 proved the wait can run for years.
Conclusion: Read the Ratio, Respect the Costs
A gold silver ratio of 80 says one thing clearly: silver is cheap against gold by historical standards. It does not say silver rises tomorrow. Smart investors use it as a compass, not a trigger. They know the zones, count the costs, and size positions so a delay never forces their hand. Build that habit and the ratio stops being trivia and starts being an edge.
The ratio keeps moving whether you watch it or not. Watch it.
Disclaimer: This article is for educational purposes only and is not financial, investment or tax advice. Precious metals prices are volatile, and you can lose money. Speak with a licensed financial professional before you make investment decisions.
References
- The Perth Mint: What is gold to silver ratio trading? Covers the 20th-century average ratio and how ratio trading works.
- MoneyWeek: A guide to the gold-silver ratio Covers the ratio’s history and the April 2020 record of 125 to 1.
- Money Metals Exchange: Gold-Silver Ratio Today, Historical Averages and What It Means for Investors Covers the 1792 fixed ratio, the 1980 low and the 2020 high.
- GoldSilver: Gold Silver Ratio at 64, What It Signals for Silver in 2026 Covers the January 2026 silver record and the ratio reading.
Sources were reviewed in October 2026. Figures differ slightly between sources, so this article quotes ranges where datasets disagree.
About the Author – Abhishek Chouhan
Abhishek Chouhan is a Global Finance Analyst and Market Researcher with over 15 years of experience studying stock markets, investor behavior, and long-term wealth cycles across the US, Europe, and Asia. He is the founder of MoneyUncut.com, a global financial intelligence platform focused on decoding market psychology, economic trends, and how human behavior shapes financial outcomes.
